Both new and long-tenure products often face the same set of questions:
- How well does the product fit its purpose?
- How quickly is it growing?
- Is the product worth doubling down the investment, or should it be retired from the portfolio?
Product leaders can answer these questions with a slide deck showing customer testimonials, fancy product images, and market trend statistics. However, narratives alone do not always give the actionable information needed to make strategic decisions.
Product metrics complement narratives by providing quantitative insights that help product teams make better decisions and communicate more effectively with stakeholders. They are important because they allow teams to:
- track product performance within its specific context,
- measure progress and learn from it,
- reduce interpretation biases when evaluating results.
This post describes product metrics across different stages of the product lifecycle. It is not a prescriptive framework. Metrics will always depend on the product, market context, and industry. However, selecting metrics that match both the product’s lifecycle stage and its type of innovation is already a significant step toward making better product decisions.
Common reasons for poor product metrics
The main challenge with product metrics is that there is no universal set that works for every product. There are countless indicators to choose from, making it easy to select product metrics that do not accurately reflect the product’s lifecycle stage and the market context.
Choosing the wrong product metrics leads to the wrong decisions. Choosing tactical vanity metrics, for example, can create an overly optimistic picture of a product but do not return clear information on how well the product is fulfilling its high-level strategic objectives. On the other hand, focusing too much on financial metrics may give an overly pessimistic view that causes promising products to die too early.
In my experience, when product metrics fail, they do it for three reasons:
- they are not in tune with the business strategy,
- they copy metrics from products or industries with different characteristics, or
- they reflect organizational and cultural habits rather than the actual needs of the product.
The following paragraphs examine each of these reasons in turn.
Strategic misalignment
Companies often evaluate early-stage products using the same financial metrics they apply to mature ones. This creates a misalignment between business strategy and product metrics. A company may aspire to enter a new market and build a long-term business, while product teams need metrics that measure whether the product is making progress toward that goal.
For example, I have worked with B2B companies whose vision was to bring innovative technologies to market. Yet they were measuring product performance exclusively through quarterly revenue and profit. This risked killing promising products too early while leaving product teams frustrated by incentives that rewarded immediate revenue rather than meaningful progress.
The solution was to redefine product metrics to reflect the uncertainty of commercializing a new technology. In practice, this meant introducing leading indicators that linked early product adoption to future financial performance. This aligned product and business objectives, while giving management earlier signals to adjust expectations and take corrective action on time.
When product metrics do not reflect the strategy the business is pursuing, they stop being decision tools and become mere reporting indicators. Instead of guiding future actions, they simply report past financial results.
One-size-fits-all metrics
Another common mistake is using metrics borrowed from other products or even entirely different industries, without considering whether they reflect the product’s lifecycle stage or business context they are in.
Many investor-backed startups tend to adopt one-size-fits-all metrics such as revenue, profit margins, growth, liabilities, assets. Established companies, on the other hand, often reuse metrics from mature products in their portfolio to benchmark new ones. In both cases, metrics are used across different contexts without considering whether they are applicable.
Instead, product metrics should reflect the stage of the lifecycle and answer three simple questions:
- Performance: How well is the product performing at its current stage?
- Risk: How likely is it to progress to the next stage?
- Need: What must improve for the product to move forward?
However, choosing the right metrics is not sufficient on its own. Equally important is calibrating expectations. Early-stage products operate under high uncertainty, and their progress should reflect the ability to test hypotheses rather than general financial performance. A 20% miss in early revenue targets is therefore less meaningful than the same deviation in a mature product, while modest deviations in growth for an established product can be far more significant than larger relative changes in an early-stage one.
Wrong prioritizaiton
Another problem beyond the one-size-fits-all syndrome has to do with prioritization.
Many companies commit too early to low-level indicators such as bux fixing, the number of incomplete features, test coverage, and so on. These are all important metrics, but they are strategically useless if not tight to strategic product metrics, especially when applied to early-stage products.
For a company still searching for product-market fit, there is often a lot of uncertainty on what works with customers and what doesn’t. Business developers and product managers talk to customers with different, and often conflicting, needs. As a result, a backlog that changes frequently or a codebase that often undergoes significant refactoring is quite common. Hence product success should consider the team’s ability to experiment, learn quickly from the market, and even change direction. This often requires prototyping, rework, changing priorities, and even temporary instability. Low-level metrics, on the other hand, might encourage teams to concentrate too much on product details that customers may never consider. Even worse, such metrics may hinder the team from experimenting and learning altogether.
Once the product achieves product-market fit and begins serving mainstream customers, priorities change and metrics with them. When the product matures, product quality, stability, and operational excellence become essential to sustain growth and scale efficiently.
Interpretation bias
Established companies are often victims of the “we have always done it that way” mindset. While this provides a sense of security in periods of stable growth or consolidation, it becomes a limitation when companies are building new products or entering new markets.
Rather than relying on metrics in isolation, it is essential to set the right expectations before looking at the numbers, and to interpret results within the appropriate strategic and operational context. The following example illustrates how a startup correctly interpreted seemingly negative revenue signals.
The example is about a startup CEO I recently worked with, who was not concerned when his B2B product experienced a particularly weak quarter in revenues. When asked about his excitement, he pointed to a previous decision to shift sales and marketing focus toward a new market, temporarily reducing effort on the existing one. As a result, he expected lower direct sales. What reassured him, was the composition of those sales: most of them were now coming through platform-driven referrals. In other words, the product itself was sustaining demand in the existing market with minimal external effort. For the CEO, this was a clear indication that the “valley of death” was over and that a new phase of product-led growth was beginning to emerge for his company.
This example highlights how metrics alone may not tell the full story. The origin of metrics and their context is often more important than their quantitative value. The problem becomes more severe when these same indicators contribute to define incentives and variable compensation for teams working on early-stage products. This creates misaligned behavior, where teams are rewarded for short-term outputs rather than meaningful progress.
Another contextual factor to consider when evalauting product success is that early-stage products exhibit exponential rather than linear revenue growth. In the first stages of an exponential curve, growth is sluggish and definitely lower than a linear growth. So, the untrained eye might easily get the impression that the product is performing poorly, while it is only physiologically following the expected exponential behavior. The consequence is that managers easily cut the investment too soon.
Interpreting early-stage performance therefore requires understanding not only the metrics, but also the underlying dynamics and context.
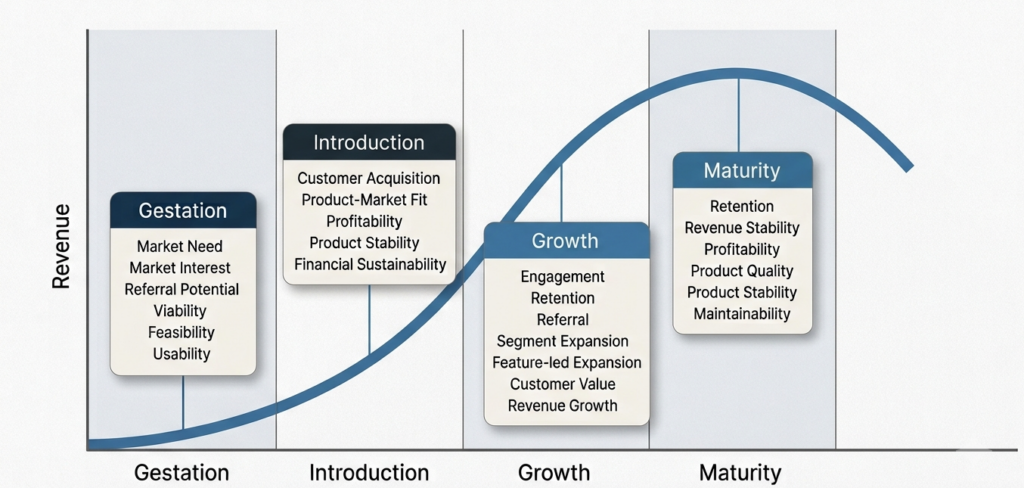
Product metrics for the 4 lifecycle stages
Products evolve in different ways. Some grow immediately after launch, others take longer to gain traction, and some that initially appear promising ultimately fail after repeated attempts. There is no universal rule that can reliably predict whether a new product will succeed in the market.
However, products do tend to follow recognizable stages of evolution. Understanding where a product sits in its lifecycle helps define which metrics are most appropriate and prevents the pitfalls discussed earlier.
The next paragraphs explore which product metrics are most relevant at each stage of the product lifecycle.
1. Gestation (pre-launch)
When products enter a market, the response is often different from what product teams expect.
Markets, including B2B ones, are people. People have their own goals, constraints, and aspirations. Even defining a customer segment is, to some extent, artificial, because it assumes we already understand how a group of people will behave and react to a given offering.
This creates uncertainty on market reaction. The only way to reduce this uncertainty is to test and observe how the market responds in practice. This is why, in the pre-launch phase, product metrics should focus on exploring market demand and customer behavior.
For many product teams, this can feel counterintuitive. There is often a strong focus on making sure the product is fully stable before anything else. That is understandable: a buggy product creates a poor first impression. But a stable product that nobody wants is far more problematic than an imperfect product that clearly solves a real need.
This does not mean stability is not important. It means that market understanding and market discovery are very important for product teams, rather than marketing alone. Product teams need direct feedback loops on how the market is responding.
Therefore, at pre-launch stage, product metrics should have a stronger focus on market testing.
The following are examples of metrics for the pre-launch stage.
| Area | Key Question | Example Metric |
| Market Need | Does the market have a real unsatisfied problem to solve? | Percentage of interviewed target customers that confirm experiencing a pain at least once per day/week. |
| Market Interest | Is there evidence of demand among early innovators for the specific product? | Percentage of visitors to the product’s landing page that register interest or join a waitlist. |
| Referral Potential | How strong are network effects among early innovators? | Percentage of users subscribed to the product that recommend the product to others. |
| Viability | Will customers pay for the product | The average amount users are willing to pay every week/month/year to use the product |
| Feasibility | Can we build the product reliably? | Percentage of acceptance tests on core use cases successfully completed |
| Usability | Can customers use the product successfully? | Percentage of test-users completing the primary product task without any assistance |
One caveat is important when selecting metrics at this stage. Because the product is not yet in the market, measurement often relies on customer opinions rather than actual behavior. However, intent does not always translate into real usage. For this reason, metrics based on actual behavior of early adopters or test users are generally more reliable than metrics based on prospective interest or intent.
2. Introduction (post-launch)
Although the market is mainly assessed during the pre-launch phase, the introduction phase is where reality kicks in. The focus shifts away from risk reduction in a controlled environment and toward two core objectives: validating product-market fit and ensuring the product can evolve quickly based on real user feedback.
At this stage, product-market fit is not measured simply by usage, but by how many engaged prospects convert to paying customers. In this way, metrics focus on actual purchasing behavior rather than just product usage. Hence, if users do not convert from free to paid tiers, the business model is likely not working. Moreover, when engagement grows but conversion remains low, it is usually a signal that either the product is reaching the wrong audience or the value proposition is not strong enough to justify adoption.
At the introduction stage, product stability becomes gradually critical. Early adopters may tolerate minor performance issues, but tolerance decreases quickly as the product scales on less forgiving customers. Stability ensures that customers can consistently complete the tasks they expect, making it a key driver of retention and product-market fit.
Typical metrics for the introduction phase are in the following table.
| Area | Key Question | Example Metric |
| Customer Acquisition | Can customers be acquired economically? | Customer Acquisition Cost (marketing, sales, distribution and onboarding costs for a single customer) compared to Expected Customer Lifetime Value (average recurrent gross profit from a single customer). |
| Product-Market Fit | Are the right customers finding enough value to pay for the product? | Percentage of prospects (people already engaging with the product) that become paying customers. |
| Profitability | Does each product sold generate value for the business? | Gross margin for each unit sold. |
| Product Stability | How reliably customers can use the product to achieve the outcomes they expect? | Percentage of the product’s core workflows completed without errors and within the expected service levels |
| Financial Sustainability | Is the business model becoming self-sustaining? | Expected time to break-even |
3. Growth
The growth stage is where every product leader wants to be, because it is the phase where at least one customer segment has recognized the value of the product and the business model works.
The challenge now is to prove that the product can address the need of even more customers. Indeed, growth may come from expanding within an existing customer segment or from addressing new segments. The latter strategy is usually more rewarding but also more challenging, because mainstream customers often have higher expectations than the early adopters who initially embraced the product. This is why Geoffrey Moore describes the transition from visionaries to mainstream customers as “crossing the chasm“.
For a scale-up, growth is not just a marketing endeavor, but also a product one. Pure marketing is expensive and often unsustainable for startups that have only recently achieved product-market fit. The product itself must therefore do much of the heavy lifting.
This does not mean marketing becomes less important. On the contrary, marketing remains essential for reaching customers who would not discover the product through existing users. However, sustainable growth increasingly depends on the product’s ability to attract, retain, and expand its user base organically.
Many successful products achieve organic growth through product-led growth. Collaboration platforms, for example, often start with a single user before encouraging colleagues to join. Consumer products may rely on communities, referrals, or social sharing features that motivate existing users to bring in new ones. In each case, growth happens because additional users increase the value of the product, and the product facilitates retention of existing customers and attraction of new ones. Hence, product metrics during the growth phase should reflect both the ability to engage existing customers and reach new ones.
Typical metrics during this phase focus on adoption, retention, expansion, and sustainable growth.
| Area | Key Question | Example Metric |
| Engagement | Is the product becoming part of users’ routines? | Growth of daily/monthly active users. |
| Retention | Are existing customers continuing to prefer the product? | Customer retention rate (portion of customers present at the start of a period that remain customers at the end of the period). |
| Referral | Are existing customers bringing in new customers? | Percentage of existing customers who made a referral. |
| Segment Expansion | Is the product succeeding with new customer segments? | Percentage of new customers from newly targeted segments subscribing to the product for the first time. |
| Feature-led Expansion | To what extent are customers adopting new product capabilities that enable expansion into additional use cases or customer segments? | Percentage of active users in new target segments successfully using newly introduced features. |
| Customer Value | Are customers becoming more valuable over time? | Customer Lifetime Value (average recurrent gross profit from a single customer). |
| Revenue Growth | Is growth translating into revenue? | Revenue growth quarter-over-quarter. |
During the growth stage, it is important to keep monitoring profitability and customer acquisition metrics defined in the introduction stage. Growth that comes at the expense of profit may signal a problem in the business model.
Conversely, market share at this stage is more relevant for investors than for product teams. While it is useful to understand how a company performs relative to competitors within an industry, market share frames performance according to a fixed set of competitors and a stable definition of the market. For a scale-up, it is also important to focus on new customers that are outside the usual profiles and are looking to address their needs with solutions outside the conventional industry boundaries.
For example, if IKEA had optimized only for market share in the traditional furniture industry, it would have focused on competing with existing furniture retailers for customers buying expensive, already assembled furniture in conventional stores. Instead, IKEA also addressed people willing to assemble furniture themselves in exchange for lower prices, as well as consumers who previously avoided furniture purchases due to cost and shopping complexity. These non-customers did not belong to any competitor’s customer base, and therefore were not captured by the traditional definition of the market.
4. Maturity
Products cannot grow forever. After a few years, growth slows down or plateaus. Naturally, the target market may saturate, shrink, or face increasing competition. At this stage, revenues remain high while development costs tend to decline, as there are no major new features. This is the phase when the product becomes a “cash cow” and generates resources needed to fund new products within the portfolio.
An important strategic decision at this stage is whether to reposition the product and pursue new customer segments or to maintain its current positioning and maximize profitability. Repositioning enables the product to enter a new growth phase, while maintaining focus extends the product’s profitable life. Product metrics should reflect this strategic decision. If the objective is to expand into new markets, many of the growth metrics remain relevant. If the objective is to maximize the product’s value as a mature offering, the focus is profitability, customer retention, product quality, and operational efficiency.
In the maturity phase, protecting the existing customer base is essential, because retaining existing customers is at least 5 times cheaper than acquiring new ones. As a consequence, product quality and stability remain important, while maintainability becomes increasingly relevant to keep operating costs under control.
The following table shows the typical metrics during the maturity phase, focusing on products whose objective it to maximize value without seeking new growth.
| Area | Key Question | Example Metric |
| Retention | Are existing customers continuing to prefer the product? | Customer retention rate (portion of customers present at the start of a period that remain customers at the end of the period). |
| Revenue Stability | Is the product maintaining predictable revenue? | Revenue variation year-over-year |
| Profitability | Is the product continuing to generate healthy profits? | Gross margin |
| Product Quality | Is the product consistently delivering the expected experience? | Customer-reported defect rate |
| Product Stability | Is the product operating reliably with minimal disruptions? | Service availability level or critical failure rate |
| Maintainability | Can the product be maintained efficiently? | Cost of maintenance year-over-year |
Choose the right metric
There is no single set of product metrics that works for every situation. What matters is not only what to measure, but also when and why to measure it.
Across the product lifecycle, uncertainty gradually decreases, and the role of metrics evolves accordingly. In the early stages, metrics are mainly about understanding whether a real market exists and whether the product solves a meaningful problem. As the product enters the market, the focus shifts toward validating product-market fit, ensuring stability, and improving conversion. In later stages, metrics become more about scaling what already works and sustaining performance over time.