Your MVP is already on the market. Customers like it and the product team is motivated. But one day a competitor launches a new product feature, or a customer gives you a hint for a nice tweak to your product. Should you add that feature to your roadmap? In some cases, you or your product manager will know the answer straight away. In other cases, you might feel you need more than just gut feeling. So, how to assess the value of a new feature idea?
In order to assess the value of a product feature idea, so that you can decide if it makes sense to go ahead and let the feature be part of your product. This process has worked well for me because it needs only a reasonable amount of effort. However there are certainly other processes out there that require more or less effort depending on how much of your time and resources you can or want to invest. Anyway, what is handy about this process is that it does not only give a value result, but it also helps to refine the feature idea along the way.
Feature value and cost
Before starting with the process of assess the value of a feature idea, let’s get some concepts straight, in particular what is a feature, its value and its cost. A feature is a product attribute that aims to satisfy one or more needs of one or more stakeholders, usually customers. Building a feature requires time and resources. For this reason, before designing it, product management evaluates its value and its cost.
Feature value
Assessing the value of a feature idea starts with the benefits. In fact, value is simply the set of benefits that customers, or stakeholders in general, receive by using the feature itself as part of the product. For the company that built the feature, customer value translates into return on investment.
Feature value can be either potential or perceived. Potential value is the entire value created by the product for customers. However, not all the potential is actually realized in actual perceived value. Some customer may not be perceived by customers because of different reasons. For example some customer may not know that a feature exist or may not be able to use it for some reason. In this post, we focus on potential value because it is the target value that a feature should strive to create even before customer perception.
Feature cost
Value alone is not sufficient to evaluate if building a feature makes any sense. Cost needs to be part of the equation too. Cost does not come only from design, build and launch activities. It also includes activities related to the full lifecycle of the feature, such as marketing, users training, roll out, maintenance, and even dismissal.
Besides, there is opportunity cost, a factor that is often neglected in cost-benefit analysis. In the contest of assessing a feature, it is the cost of foregoing other business opportunities in order to launch and keep alive the feature. In reality, even when a feature looks promising, its opportunity cost might be too high. For example, opportunity cost comes from missing out on ludicrous client customizations when budget and talent are used to build a product feature.
In the remaining part of the post we address the value part, as it is often the first indicator of a feature’s viability.
The 10 steps to assess the value of a feature
If you are asked to assess the value of a feature idea, you will find it is not as easy as it sounds. On one hand, product managers do not like to build features that are not viable or have low customer value. Besides, they tend to keep products simple. On the other hand, they cannot afford spending too much time or resources to analyze the market for each and every feature, especially if time-to-market is crucial. So, estimating value accurately, for example in terms of net present value of the investment, is often difficult, although ideal. This is because, as a rule of thumb, the more accurate the estimation needs to be, the higher the time and resources needed to put it together.
For these reasons, qualitative estimations like the one in this post can be a shortcut to quickly evaluate the value of a feature without breaking the bank. Thus, this process can be a rapid way to distill the most valuable feature ideas or to quickly go to the market and get actual customer feedback straight away.
The example
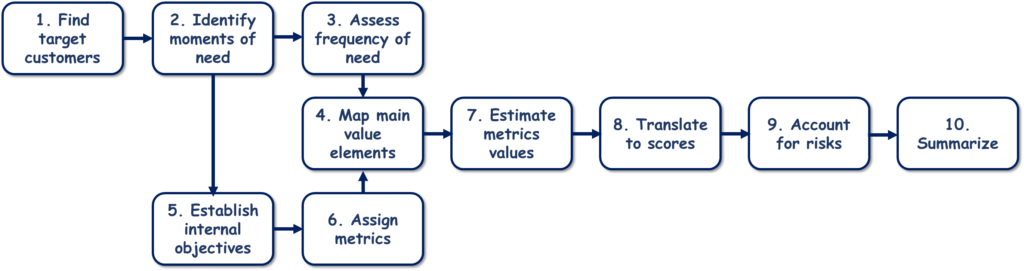
This process of estimating a feature’s value goes through 10 steps, each aimed at answering questions around relevance, frequency and cost of the feature. While explaining the process, I will provide with an example from a fictitious and simplified case. In the example, the product is a ride sharing app. It allows people to subscribe to a private network so that they can request or offer car rides. In a nutshell, it is a sort of invite-based BlaBlaCar. For each step of the process, we will go through a brief explanation before referring to the example. The feature in the example is called “rate the ride”. It allows drivers and riders to rate each other at the end of each ride.
Step 1: Find target customers
The first step of the process consists of identifying all customer segments, or users in general, that might have an interest in the feature. These segments can be existing ones or even new ones, who will start using the product just because of the new feature. Going through a brainstorming activity or evaluating existing customer feedback is a great start for this step. While identifying segments, it is also important to estimate the share of the product market for each segment, as it will turn out to be useful at a later step.
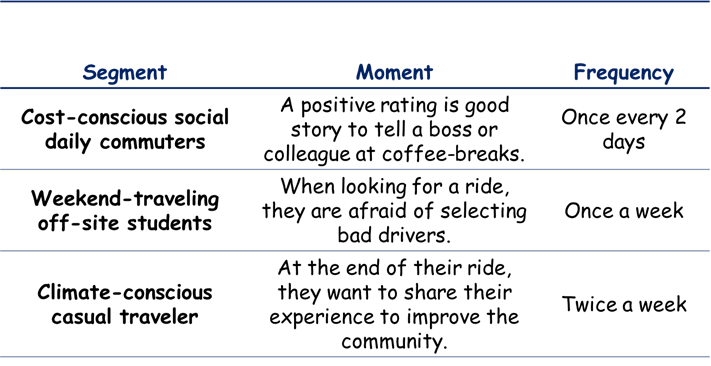
For the “ride rating” feature example, the three segments impacted would be the following, each having a certain shar eof the total market of the app:
- Cost-conscious social daily commuters (share 30%). Drivers that share their car every morning to socialize with colleagues and save on fuel.
- Weekend-traveling off-site students (share 20%). Students that take weekend rides to go back to their home town or just to see new places.
- Climate-conscious casual traveler (share 20%). People that share rides in order to reduce their environmental footprint when public transport is not convenient.
Step 2: Identify moments of need
The next step is to define in which moment of the daily or weekly routine customers, or stakeholders, need the feature. So, this step questions what customer pain does the feature alleviate or what improvement does the feature bring. Customer observation, user research, and interviews can help identifying such moments of need.
Step 3: Assess frequency of need
The next step is to guess or discover how often each of the identified moments of need happens. This information translates into how often the feature will impact the same customer.
For the “ride rating” feature, each segment has one moment of need and frequency.
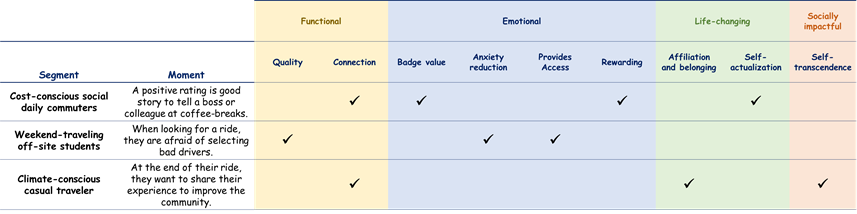
Step 4: Map main value elements
Now it is time to go a bit deeper on the feature creates during the identified moments. Recent research by Bain & Company shows how, for B2C products, there can be up to 30 different elements of value. They are hierarchically organized as functional, emotional, life-changing and socially impactful. In the same way, B2B products can offer up to 40 value elements hierarchically organized as functional, ease of doing business, individual, inspirational. So, for the “ride rating” feature, we simply map each moment to one or more value elements.
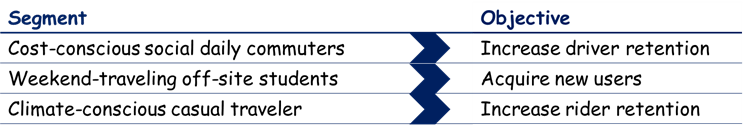
Step 5: Establish internal objectives
Now that we know what impact the feature has on customers, let’s translate it into internal objectives. Indeed, a feature may produce different benefits for the company, not directly related to profitability. Inspired by Sauring Shah, these are some possible objectives for a new feature:
- Acquire new leads, prospects or users
- Convert users from non-paying to paying
- Increase retention of existing users and reduce churn
- Reduce variable cost to acquire or serve a customer
- Reduce fixed and platform costs
- Increase operational efficiency to develop or operate the product (reduce semi-fixed costs)
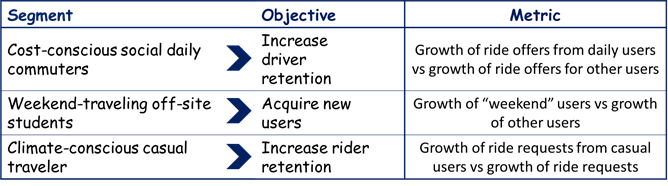
- For the “ride rating” app, there are 3 different objectives, one for each segment.
Step 6: Assign metrics
Once we establish objectives, we need a way to measure them. This is why metrics matter. There are many metrics to choose from. However, a good practice is to stay away from what Eric Ries calls vanity metrics, gross metrics such as total number of users and total revenue. This is because such metrics are dependent from too many variables and they do not convey information directly related to an actual feature. It is a better practice, instead, to focus on specific actionable metrics that help to judge if a feature is successful or not.
For example, measuring the number of monthly active users before and after the launch of the feature is a gross metric. On the other hand, measuring and comparing the number of new users in a given month on two parallel versions of the product, one with the feature and the other without, is a much more effective measurement. Below some metrics for the “ride rating” feature.
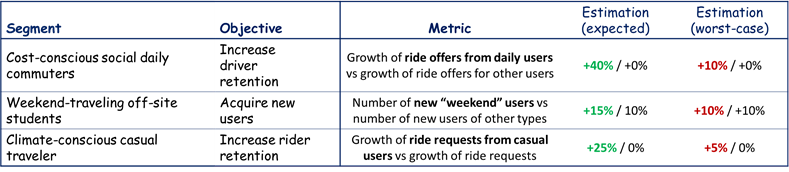
Step 7: Estimate value metrics
Once we assign metrics, it is important to estimate an expected value for each metric, as well as a minimally achievable value. This latter helps estimating the impact in a plausible worst-case scenario. In order to come up with a number for the expected value and the minimally achievable value, the frequency of need identified in step 3 and the impacted value elements in step 4 can be used as guidance. Indeed, the higher the number of impacted elements the higher the impact value. In the same way, the higher the frequency of the moment, the higher the value. Below some metrics for the “ride rating” feature.
Step 8: Translate to scores
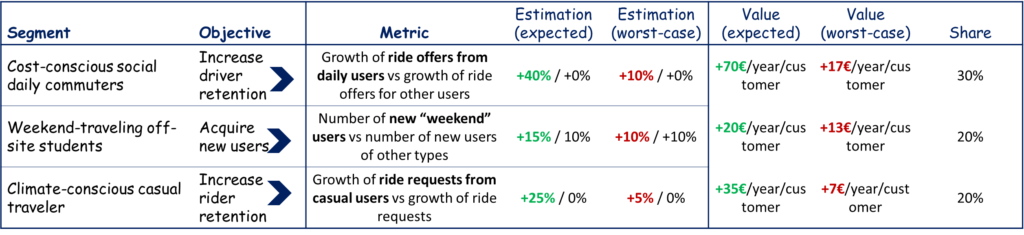
In the majority of cases, the previous steps are sufficient to evaluate what value to expect from a feature. However, sometimes it is useful to translate the metric estimation to some scoring function or a monetary value. This helps to compare different features with each other. This step should consider both the expected and the worst-case values for each metric. At this stage we consider the customer share, as it will be used in the final step of the process.
For the “ride rating” feature example, we translate each metric into a monetary value for each segment.
Step 9: Account for risks
New feature introduces change. With change, the risk that something goes wrong increases. Risks can entail a small part of the product or even the entire business. In this process, risks do not change the values calculated so far. On the other hand, identifying risks is important to create awareness on what can go wrong. In particular, identifying risks allows to think in advance about strategies to reduce or remove risks. Let’s look at some examples of risks in the context of a new product feature. These risks are:
- Unintended use
- Ethical, social or ecological concerns
- Complication of product UX
- Complication of portfolio offerings
- Cannibalization of other products
- High maintenance / upgrade cost
- R&D uncertainty, unexpected bugs or technical debt
For the “ride rating” feature example, here a couple of risks:
- “Users that already knew each other can post positive ratings just to please each other. This may promote bad drivers and finally create negative impact to the platform. Introducing some manual control will limit fake ratings. However, this comes with a cost in terms of human resources.”
- “In the current product, showing ratings may clutter the UI. So, we will redesign them to avoid negative impacts on UX”.
Step 10: Summarize
At this stage of the process you should be able to decide if adding the feature to the product roadmap makes sense. Or, at least, the process should give you a hint on whether you need a more accurate analysis. Most likely, you want to present the assessment without overwhelming your audience. Thus, bringing all the insights into one single figure can help to present more effectively.
The single value figure is calculated in 2 stages. First, multiply the value for each segment by the segment’s market share to get the weighted value for the segment. Second, sum up all the weighted values to come up with the single value figure.
In addition, it is a good practice to add a brief text summary, explaining the highlights of the analysis, to the aggregated figure. The remaining details can be left for the the back of the presentation.
For the “ride rating” feature example, the value figure and the summary are presented as follows.

Conclusion
With these 10 steps, proposing a new feature should become less of a bet and more of a thought-through process. However, the proof is in the pudding. So, once you go through this evaluation process, it is a good idea to design a minimum viable feature (MVF) rather than a full version of the feature. By doing so, you will go live with the minimal required functionality to test the validity of your assumptions and validate your assessed value. Nevertheless, how to design a minimum viable feature will be a topic for one of the next posts.
For the time being, if you tried my process to assess the value of a feature or any other method, please leave a comment below. For any other question, you are mostly welcome to get in touch!