Let’s say you are at a multi-product company that designs and maintains multiple products. Some products are on the market for some time already, some others are rather new. These products target different customer segments or even completely different markets. If you are in charge of taking decisions about one product or maybe you are in charge of portfolio management, you may need to classify your products to allocate resources effectively and facilitate strategic planning. If this resembles your case this post might be for you.
One of the main challenges in product portfolio management is to allocate resources effectively to different products. In this context, products are a bit like children (with all the due differences). Depending on their age, product cannot always look after themselves with respect to their own needs. Without external resources, they cannot grow. Thus, portfolio managers are like parents. Sometimes they have to say no. This happens for two main reasons. First, they have limited resources at their disposal, no matter how “rich” they are. Second, some demands should be satisfied only at the right stages of development, otherwise products (or children) may grow too quickly.
Now, this post is not about parenting. For that, you should look somewhere else. This post is about how to allocate resources to products in a portfolio. In particular, this post describes how to classify your products to allocate resources effectively and make long-term strategic planning easier. This post does not offer any professional advice. This is because every portfolio and company is different. For example, some companies may require less efficiency but more accuracy, therefore this approach may sound minimalistic. In any case, this post is rather a general point of view to enrich interest and knowledge on resource allocation for product portfolios.
Why product classification matters
Resource allocation is a tricky portfolio management activity. This is because a company’s products are usually very different between each other, not just because of their components, but mostly because of the different customer needs they address. The more products there are in a portfolio, the more decision complexity tends to skyrocket. A portfolio manager cannot drown in this complexity, but needs to keep an overall view on the company’s business strategy and finances. In this way, decisions can target what is best for the company, not just each individual product. This is why, simple decision criteria are key for a portfolio manager enable decision speed and effective communication. One simple criterion to to allocate resources effectively is to classify products first. This is particularly true for companies with many products, is to start by classifying products into categories. In this way, resource allocation decisions can stand on categories rather than on every product’s peculiarity.
A simple framework to classify products
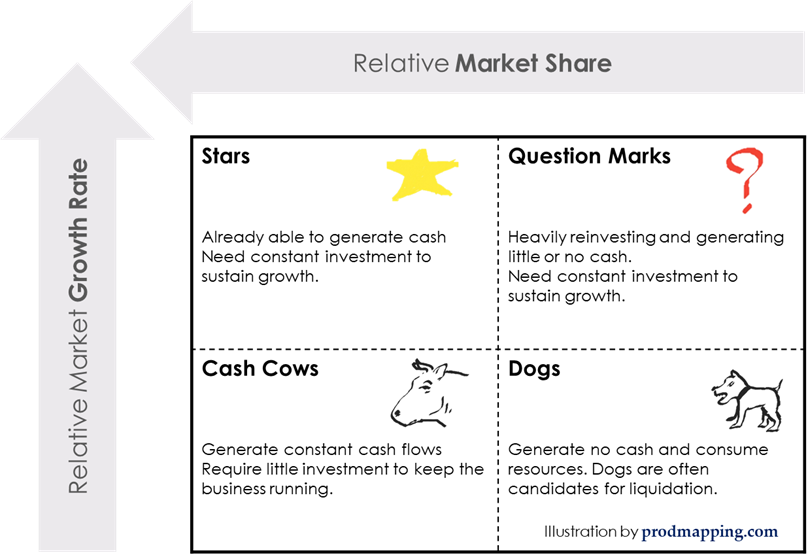
How to classify products to allocate resources effectively? A quick search on the web would return different popular management frameworks for this aim. In this post, we revisit a simple yet visually powerful tool called “growth-share matrix”, “product portfolio matrix”, or simply “BCG matrix”. Bruce Henderson, the founder of the Boston Consulting Group, invented this management framework in the late sixties. The tool is widely used to assess companies, products and business units with respect to two dimensions, the product’s current market share and the expected market growth. Having just two dimensions makes it easy to visualize the classification on a two-dimensional matrix. Depending on these dimensions, products fall in one of the four quadrants of the matrix. In a nutshell the matrix looks like the one here below.
Let us look at the four quadrants one by one.
Question marks
Products in this quadrant have low market share but high growth. Typically, these products have already found the right market and they start expanding the customer base beyond early adopters. However, they need lots of capital in order to gain market share and establish themselves as true winners. Investments usually finance development of new product features, improvements of user experience, building customer awareness and reaching out to customers.
Stars
Products in the “stars” quadrant exhibit high market share and high growth. Stars are successful products that are popular among mainstream customers and keep growing at high pace. Stars are mostly self-sustaining because their profits generate enough cash to sustain continuous growth. The typical resource allocation strategy for this kind of products is to improve product performance, consolidate customer relationships, establish economies of scale that can bring down fixed costs, and serve new customer segments that were previously too costly to serve.
Cash cows
“Cash cow” products also enjoy high market share in the industry. So, they have abundant cash in excess to their needs. Differently from “stars” and “question marks” their growth is small or even slightly negative. Usually, a cash cow product was previously a star, but has saturated the market with time. Such products enjoy large cash flows that can support other promising products in the portfolio, such as stars and question marks. For “cash cow” products, the best strategy is often to defend the market position and keep high customer retention through constant product quality upgrades, effective pricing and possibly differentiation.
Dogs
Dogs have low market share and low growth. Usually they are products that were very successful in the past, “star” or “cash cow” products, but are now on a decline trend. They are not able to sustain themselves anymore, so they require external resources to stay alive. However, such resources can better support products in the other three quadrants. Therefore, often the best strategy for “dog” products is to downsize or liquidate them in order to avoid increasing costs.
Mapping products to their lifecycles
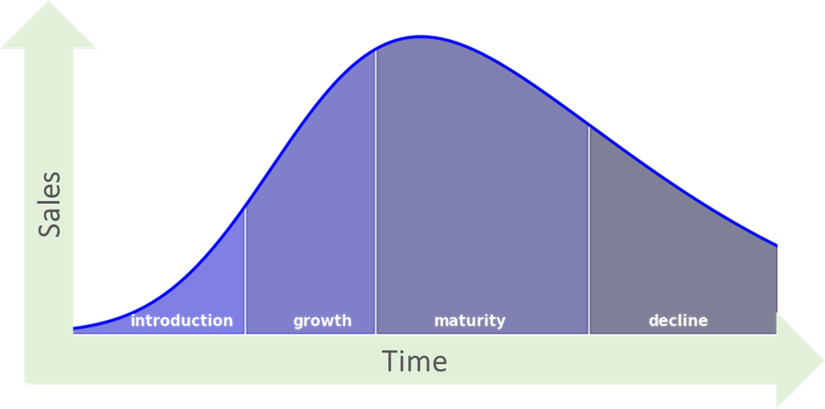
While visualizing a 2-by-2 matrix is already a powerful representation to classify your products to allocate resources effectively, it misses the perspective of time. In other words, how will products evolve through the matrix during their life? This is why you might need to map each product portfolio to a product lifecycle. In fact, products mostly go through four stages: introduction, growth, maturity and decline.
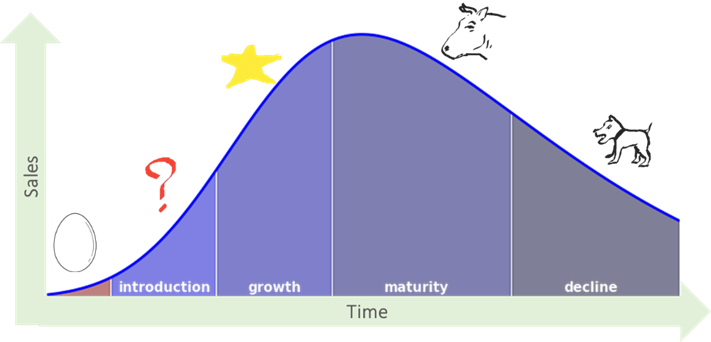
What is interesting is that these four stages fit to the four quadrants of the “Growth-Share” matrix. In other words, a successful product starts out by being a question mark. After a while, it becomes a “star”. Then, it grows into a “cash cow”. Finally, it becomes a “dog”. Alas, positioning a product in terms of growth and market share generally corresponds to position it on the product lifecycle.
“Eggs”, the fifth product type
What is interesting is that these four stages fit to the four quadrants of the “growth-share” matrix. In other words, a successful product starts out by being a question mark. After a while, it becomes a “star”. Then, it grows into a “cash cow”. Finally, it becomes a “dog”. Alas, positioning a product in terms of growth and market share generally corresponds to position it on the product lifecycle.
Clearly, the fact that a product evolves in such a predictable way is not always realistic. Indeed, not all products are successful. The majority of them never make it to become a “star” or a “cash cow”. Even those that become stars could decline immediately without ever becoming “cash cow”. Nevertheless, in terms of product strategy, predicting that a product moves through these four stages can be safe, in absence of other detailed information.
If you look at the product lifecycle carefully enough, you might notice there is an initial phase when a product has very small sales and almost no growth. This kind of product is not a “dog”, because sales are not declining. They are rather increasing, just slowly. So, let us add a fifth product type to classify these brand new products. Just for the sake of this post, let us call these types of products “eggs”. The name reflects the fact that they are promising but with lots of unknown, including their growth potential. Many new products fail, never becoming “question marks”. This is why “egg” products are probably the most frequent ones. For them, the proper resource allocation strategy can be to invest on understanding customer needs or to finding the right business model so that the product can better address market needs.
Six steps to classify products
Given the growth-share matrix, in its original form or in the modified way, let us go step by step into positioning a product into the right stage, so that classifying products to allocate resources effectively becomes easier.
1. Identify the market
Each product should have a target market, a group of customers that share some common traits that make them well suited to the product itself. A market is usually made of different segments, each having specific traits. For example, a segment of the “ride-sharing” market is “daily commuters”.
The target market can be arbitrarily broad and it depends on how ambitious is the product vision. Products with a more focused vision target niche markets, which are smaller and have less competition. For example, a niche of the ride sharing market is “ride-sharing for seniors”. In any case, a product cannot reach or service the whole market from day one. Most likely, a product will first target a specific market niche that it is easier to serve. For example, although the market for Impossible Burger can be “plant-based meat”, a more niche market can be “gourmet burgers for fast-food restaurants”.
To identify a market, you can go by 3 approaches: substitution, needs and features. A substitution-based definition is preferable for new products that have no other similar products on the market. In this case, you assess the market by looking at substitutes that allow customers get the job done. A needs-based market, on the other hand, stems from all the different products, even if completely different, that address the same customer needs that your product addresses. Finally, a feature-based market definition defines the market according to competitors offering the same product features. For existing markets, defining markets according to features makes sense, because it is rather simple to find products that offer similar features to those of your product. Anyway, there is no best definition for every case. It pretty much depends on the characteristics of your product and your customers. For more details on market definitions, this post is a good read.
2. Assess market size
Market size defines the total revenue during a given period, usually a quarter or a year, from the sales of the products in that market. Instead of revenue, sometimes unit sales is a good indicator too, especially for commodity products whose prices are quite homogeneous. For digital products such as apps, good revenue indicators are, among others, the number of app installs or the number of active users in a given period.
In practice, gathering such data is time consuming, because it requires research in publicly available data and financial reports of companies, if accessible. Luckily, market research companies have ready-available reports with key figures. So, purchasing a report can be a good step depending on the available budget. Another alternative to evaluate the market is based on estimations. It is based on of making reasonable hypotheses on the number of sales for a market. Such hypothesis depend on many factors related to the willingness to buy of the people within a market.
Unfortunately, a single solution that fits all cases does not exist. The best approach is the one that strikes a balance between data accuracy and resources, depending on the individual case.
3. Assess market growth
Together with market size, market growth is a key parameter to classify a product. In the same way as for market size, you can find market growth through publicly available reports. You will need either current growth or estimated growth.
Current annual growth is a relative number. It comes from the difference between last year’s and previous year’s market sizes, all divided by previous year’s market size. You can also use quarterly growth. However, quarterly data might be seasonal. In other words, sales may depend on the specific quarter. Think about sales of sparkling water. Sales in the summer will likely be higher than sales in winter. This means that for market growth on a quarterly basis, you should compare data from the same quarters in different years.
Sometimes you may find, or calculate, estimated growth instead of actual growth. Estimated growth comes from projecting historical rate of growth into the future. The logic is that if last year’s growth was increasing by a certain amount, next year’s growth will increase in the same way. This kind of estimation remains a mathematical forecast that usually does not account for possible changes in the economy, technology or consumer habits that may affect the market.
Some report indicate estimated growth as compounded annual growth rate (CAGR) for a certain number of years in the future. It reflects the constant annual growth rate expected in order to reach a certain market size by the end of the period. It is useful because it does not only give an estimate of growth but also a clue on the number of years that such a growth will last.
Current annual growth is usually the best type of growth to consider because it is easier to explain. However, depending on the product and the availability of data, other growth indicators might be better.
4. Derive market share
If you have done the previous steps correctly, product market share should be very simple to get. It is the amount of sales of your product with respect to all the sales to that market in a given period. It just comes from dividing your product’s sales with respect to the overall market’s sales. Of course, this presumes that you know your product’s sales figures.
5. Define thresholds
Once you have market share and growth data for each product, how do you know if a product’s market share, or market growth, is high or low? Indeed, there is no general threshold.
Generally, for market share I follow a rule inspired by the New Lanchester Strategy. If you have products with market share above 40% (41.7% to be exact), your product is in a market leadership position. This means that your product can go to the left side of the “growth-share” matrix. If, on the other hand, your market share is lower than 40%, things are different. Unless your product has a consistent advantage on your runner-up, you can say that your product has a low market share.
Now let us talk about growth. What makes growth high or low depends pretty much on other products you have in your portfolio or other investment opportunities for your company. For example, if the average market growth in your portfolio is 20%, and your company cannot reach 20% growth through other investment with the same risk of your portfolio, then 20% is a good threshold between low and high growth for your portfolio. On the other hand, if your company can achieve a higher growth, say 25%, with other investments, then 25% is a better threshold.
6. Position products
Once you have executed the above steps for all the products, you can position your products on the growth-share matrix or the product lifecycle. That means that you can now classify your portfolio products to allocate resources effectively. Depending on where each product finds itself among the four or five types, you can choose a proper resource allocation strategy that makes sense with the product.
What’s next
If you have reached this point, classifying your products to allocate resources effectively should sound easier. The next step is to allocate resources such as budget, time and talent in order to make your product grow, each with its own pace.
Keep in mind that your products portfolio is likely unique. Thus, you cannot just follow this guide step by step. You will have to dig deeper or wider in order to get the job done. Anyway, having classified your products should make resource allocation a more comfortable activity.